
部分索引是节省磁盘空间和提高记录查找性能的好方法。共同的规则是“用它当你能负担得起”——换句话说,如果你所有的查询涉及到一些过滤器,这是通常被认为是一个好主意,以包括过滤索引定义,以减少其规模和改善其性能(指数越小,越快就会执行相应的索引扫描或IndexOnlyScan)。
但是,部分索引是否总是提供更好的性能?好,让我们看看。
举个简单的例子:
create table asset(
id bigserial primary key,
owner_id int8 not null,
name text not null,
price int8
);
假设在这个表格中我们存储了一些资产的信息,让我们用一些样本数据来填充它:
insert into asset(
owner_id,
name,
price
)
select
i,
round(random()*100000)::text,
round(random() * 10000)
from generate_series(1, 600000) _(i);
再加入更多的样本数据,这次的价格“未知”:
insert into asset(
  owner_id,
  name,
  price
)
select
  i,
  round(random()*100000)::text,
  null                                     -- price is unknown (yet)
from generate_series(600001, 1000000) _(i);
vacuum analyze asset;
现在我们有100万条记录,其中40%的价格未知(无效)。
价格会不时变化,因此任何记录都可能被更新为新的、经过修正的价格值。
接下来,考虑这样一种情况:我们需要快速找到属于某个特定用户的所有资产,但我们从不对价格未知的记录感兴趣:
select *
from asset
where
owner_id = :owner_id
and price is not null;
我们需要使用什么索引?我们很自然地认为,这部分指数将完美地满足我们的需要:
create index i_asset_price_partial
on asset
using btree(owner_id)
where price is not null;
但是拥有最好的表现真的有帮助吗?
这得视情况而定。
首先,这样的索引会小得多,即常规的全表索引:
create index i_asset_price_full
on asset
using btree(owner_id);
让我们来比较一下它们的大小:
test=# \x
Expanded display is on.test=# \di+ i_asset_price_partial
-[ RECORD 1 ]----------------------
Schema      | public
Name        | i_asset_price_partial
Type        | index
Owner       | nikolay
Table       | asset
Size        | 13 MB
Description |test=# \di+ i_asset_price_full
-[ RECORD 1 ]--------------
Schema      | public
Name        | i_asset_price_full
Type        | index
Owner       | nikolay
Table       | asset
Size        | 21 MB
Description |
正如预期的那样,全表索引的大小更高——21 MB vs 13 MB,因此比部分索引大60%左右。这是您可以决定的时候—好吧,我最好使用部分索引(就像我在优化的一个Postgres实例中所做的那样)。但是不要着急,等一会儿。
那么SELECT性能呢?让我们用pgbench快速检查一下,这是Postgres的本地基准测试工具:
echo "\set owner_id random(1, 1 * 1000000)" > selects.bench
echo "select from asset where owner_id = :owner_id and price is not null;" >> selects.bench
pgbench -n -T 30 -j 4 -c 12 -M prepared -f selects.bench -r test
在没有索引的情况下,我的笔记本只有13.12 TPS(每秒事务数):
$ pgbench -n -T 30 -j 4 -c 12 -M prepared -r test -f selects.bench
transaction type: selects.bench
scaling factor: 1
query mode: prepared
number of clients: 12
number of threads: 4
duration: 30 s
number of transactions actually processed: 397
latency average = 915.767 ms
tps = 13.103765 (including connections establishing)
tps = 13.113909 (excluding connections establishing)
script statistics:
- statement latencies in milliseconds:
0.003 \set owner_id random(1, 1 * 1000000)
908.755 select from asset where owner_id = :owner_id and price is not null;
连续扫描不适合在干草堆里找针。这里没有惊喜。
全表索引(单独定义,不包含部分索引):
$ pgbench -n -T 30 -j 4 -c 12 -M prepared -r test -f selects.bench
transaction type: selects.bench
scaling factor: 1
query mode: prepared
number of clients: 12
number of threads: 4
duration: 30 s
number of transactions actually processed: 779801
latency average = 0.462 ms
tps = 25963.230818 (including connections establishing)
tps = 25972.470987 (excluding connections establishing)
script statistics:
- statement latencies in milliseconds:
0.001 \set owner_id random(1, 1 * 1000000)
0.460 select from asset where owner_id = :owner_id and price is not null;
和部分索引(再次定义,没有全文):
$ pgbench -n -T 30 -j 4 -c 12 -M prepared -r test -f selects.bench
transaction type: selects.bench
scaling factor: 1
query mode: prepared
number of clients: 12
number of threads: 4
duration: 30 s
number of transactions actually processed: 817490
latency average = 0.440 ms
tps = 27242.705122 (including connections establishing)
tps = 27253.100588 (excluding connections establishing)
script statistics:
- statement latencies in milliseconds:
0.001 \set owner_id random(1, 1 * 1000000)
0.439 select from asset where owner_id = :owner_id and price is not null;
可以看到,使用部分索引的select要比使用全表索引的select快一点(~5%)。这是我们所期望的。
现在让我们看看更新性能的不同。我们将只接触那些已经定义了价格的记录,以保持null(40%)的数量不变,以防我们想要做更多的实验:
echo "\set id random(1, 1 * 600000)" > updates.bench
echo "update asset set price = price + 10 where id = :id;" >> updates.benchpsql test -c 'vacuum full analyze asset;' && \
  psql test -c 'select pg_stat_reset();' >> /dev/null && \
  pgbench -n -T 30 -j 4 -c 12 -M prepared -r test -f updates.bench
当除主键外没有索引时:14553 tps。
全文索引:14371 tps。
部分索引:12198 tps。
这看起来可能令人惊讶——部分索引显著地(约14%)减慢了更新速度!
为什么如此?要回答这个问题,让我们看看Postgres内部统计信息pg_stat_user_tables。注意到我们在运行pgbench进行更新之前调用了pg_stat_reset()函数吗?这是为了重置整个Postgres集群的统计数据并收集新的数据。现在,如果我们用这个查询每次实验后检查这个查询的结果:
select
n_tup_upd,
n_tup_hot_upd,
round(100 * n_tup_hot_upd::numeric / n_tup_upd, 2) as hot_ratio
from pg_stat_user_tables
where relname = 'asset';
我们会看到这样的情况:
-- no indexes except PK
 n_tup_upd | n_tup_hot_upd | hot_ratio
-----------+---------------+-----------
    436808 |        409220 |     93.68-- full-table index
 n_tup_upd | n_tup_hot_upd | hot_ratio
-----------+---------------+-----------
    431473 |        430807 |     99.85-- partial index
 n_tup_upd | n_tup_hot_upd | hot_ratio
-----------+---------------+-----------
    366089 |             0 |      0.00
这些数字很清楚——在部分索引的情况下,我们将完全失去热更新。HOT表示仅堆元组,这是PostgreSQL执行元组更新的内部技术。虽然在PostgreSQL的主文档中没有详细的说明,但是你可以在README中找到详细的解释。来自Postgres源文件的热(或阅读本文:“使用热更新提高更新查询的速度”)。
简而言之,如果在更新期间,新老元组(行你更新的版本)都位于同一页面的内存,这更新不修改任何索引列,特殊类型的优化会发生,这将允许Postgres节省时间,首先,因为它不会改变索引条目。
但是这里的索引列究竟是什么呢?自述文件。热解释:
HOT解决了一个受限但有用的特殊情况:一个tuple以不改变其索引列的方式重复更新。(这里的“索引列”是指在索引定义中引用的任何列,包括例如在部分索引谓词中测试但不存储在索引中的列。)
在我们的例子中,索引依赖于price列,它是我们的部分索引谓词,一旦我们更改它,Postgres就不能使用HOT,因此我们的更新(和删除)通常会变慢。
我相信这可以在Postgres内部进行优化:如果tuple中的旧值和新值都有price不为空,这意味着没有理由触及索引。但是Postgres内部没有这样的优化(到2018年3月,最新版本是Postgres 10),所以开发人员在优化数据库模式和查询时必须牢记这一点。
我希望你不会认为部分索引是不利于更新性能——这并不坏,但是你需要注意你使用的组列索引定义和记住这个增益之间的权衡选择性能和更新性能可能的损失。
这只是众多例子中的一个,在非专业人士的眼中,数据库优化过程是多么棘手——我经常听说Postgres DBA的工作是一种“魔法”。如果您需要处理数百或数千个表、索引和其他DB对象,并试图玩打地鼠游戏,那么猜测哪些更改对您最有帮助。在优化一个SQL查询时,通常会损害其他查询的性能
我相信在不久的将来会出现新的自动化数据库管理工具,帮助dba和开发人员进行性能优化。
同时,我建议使用我的新项目postgres_dba——它是一个SQL报告集合,绑定到一个方便的工具集,可以在psql中以交互模式运行。这是一个名为“3 - Load Profile”的特殊报告,它允许您查看每个表中选择、插入、更新和删除了多少元组,以及所有更新中热更新的比例:
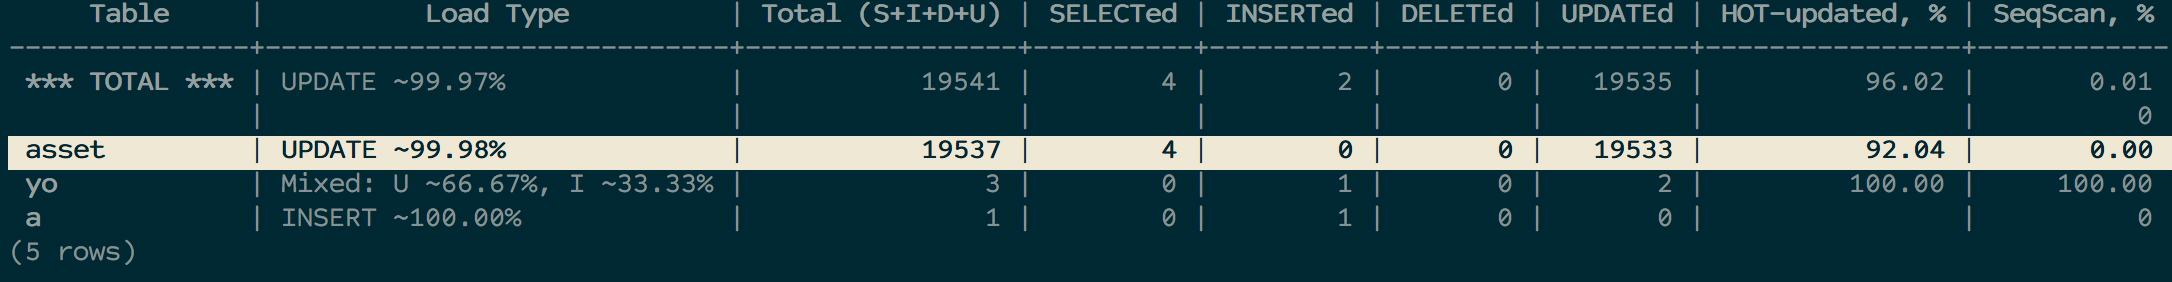
来自postgres_dba工具集的报告“3 - Load Profile”显示了数据库中每个表的热更新比率
这是控制表的更新性能的一种非常基本的方法。如果您看到一个表的热更新率很低,那么为了理解为什么需要检查这个表的所有索引定义—它们是否允许热更新,或者更新查询是否涉及参与某些索引定义的列?
原文:https://medium.com/@postgresql/how-partial-indexes-affect-update-performance-in-postgres-d05e0052abc
本文:http://jiagoushi.pro/how-partial-indexes-affect-update-performance-postgres
讨论:请加入知识星球【首席架构师圈】或者微信圈子【首席架构师圈】